|
knngraph is
a set of rather trivial command line tools, written in Python , to visualize the nearest
neighbours relations in a Timbl instance base.
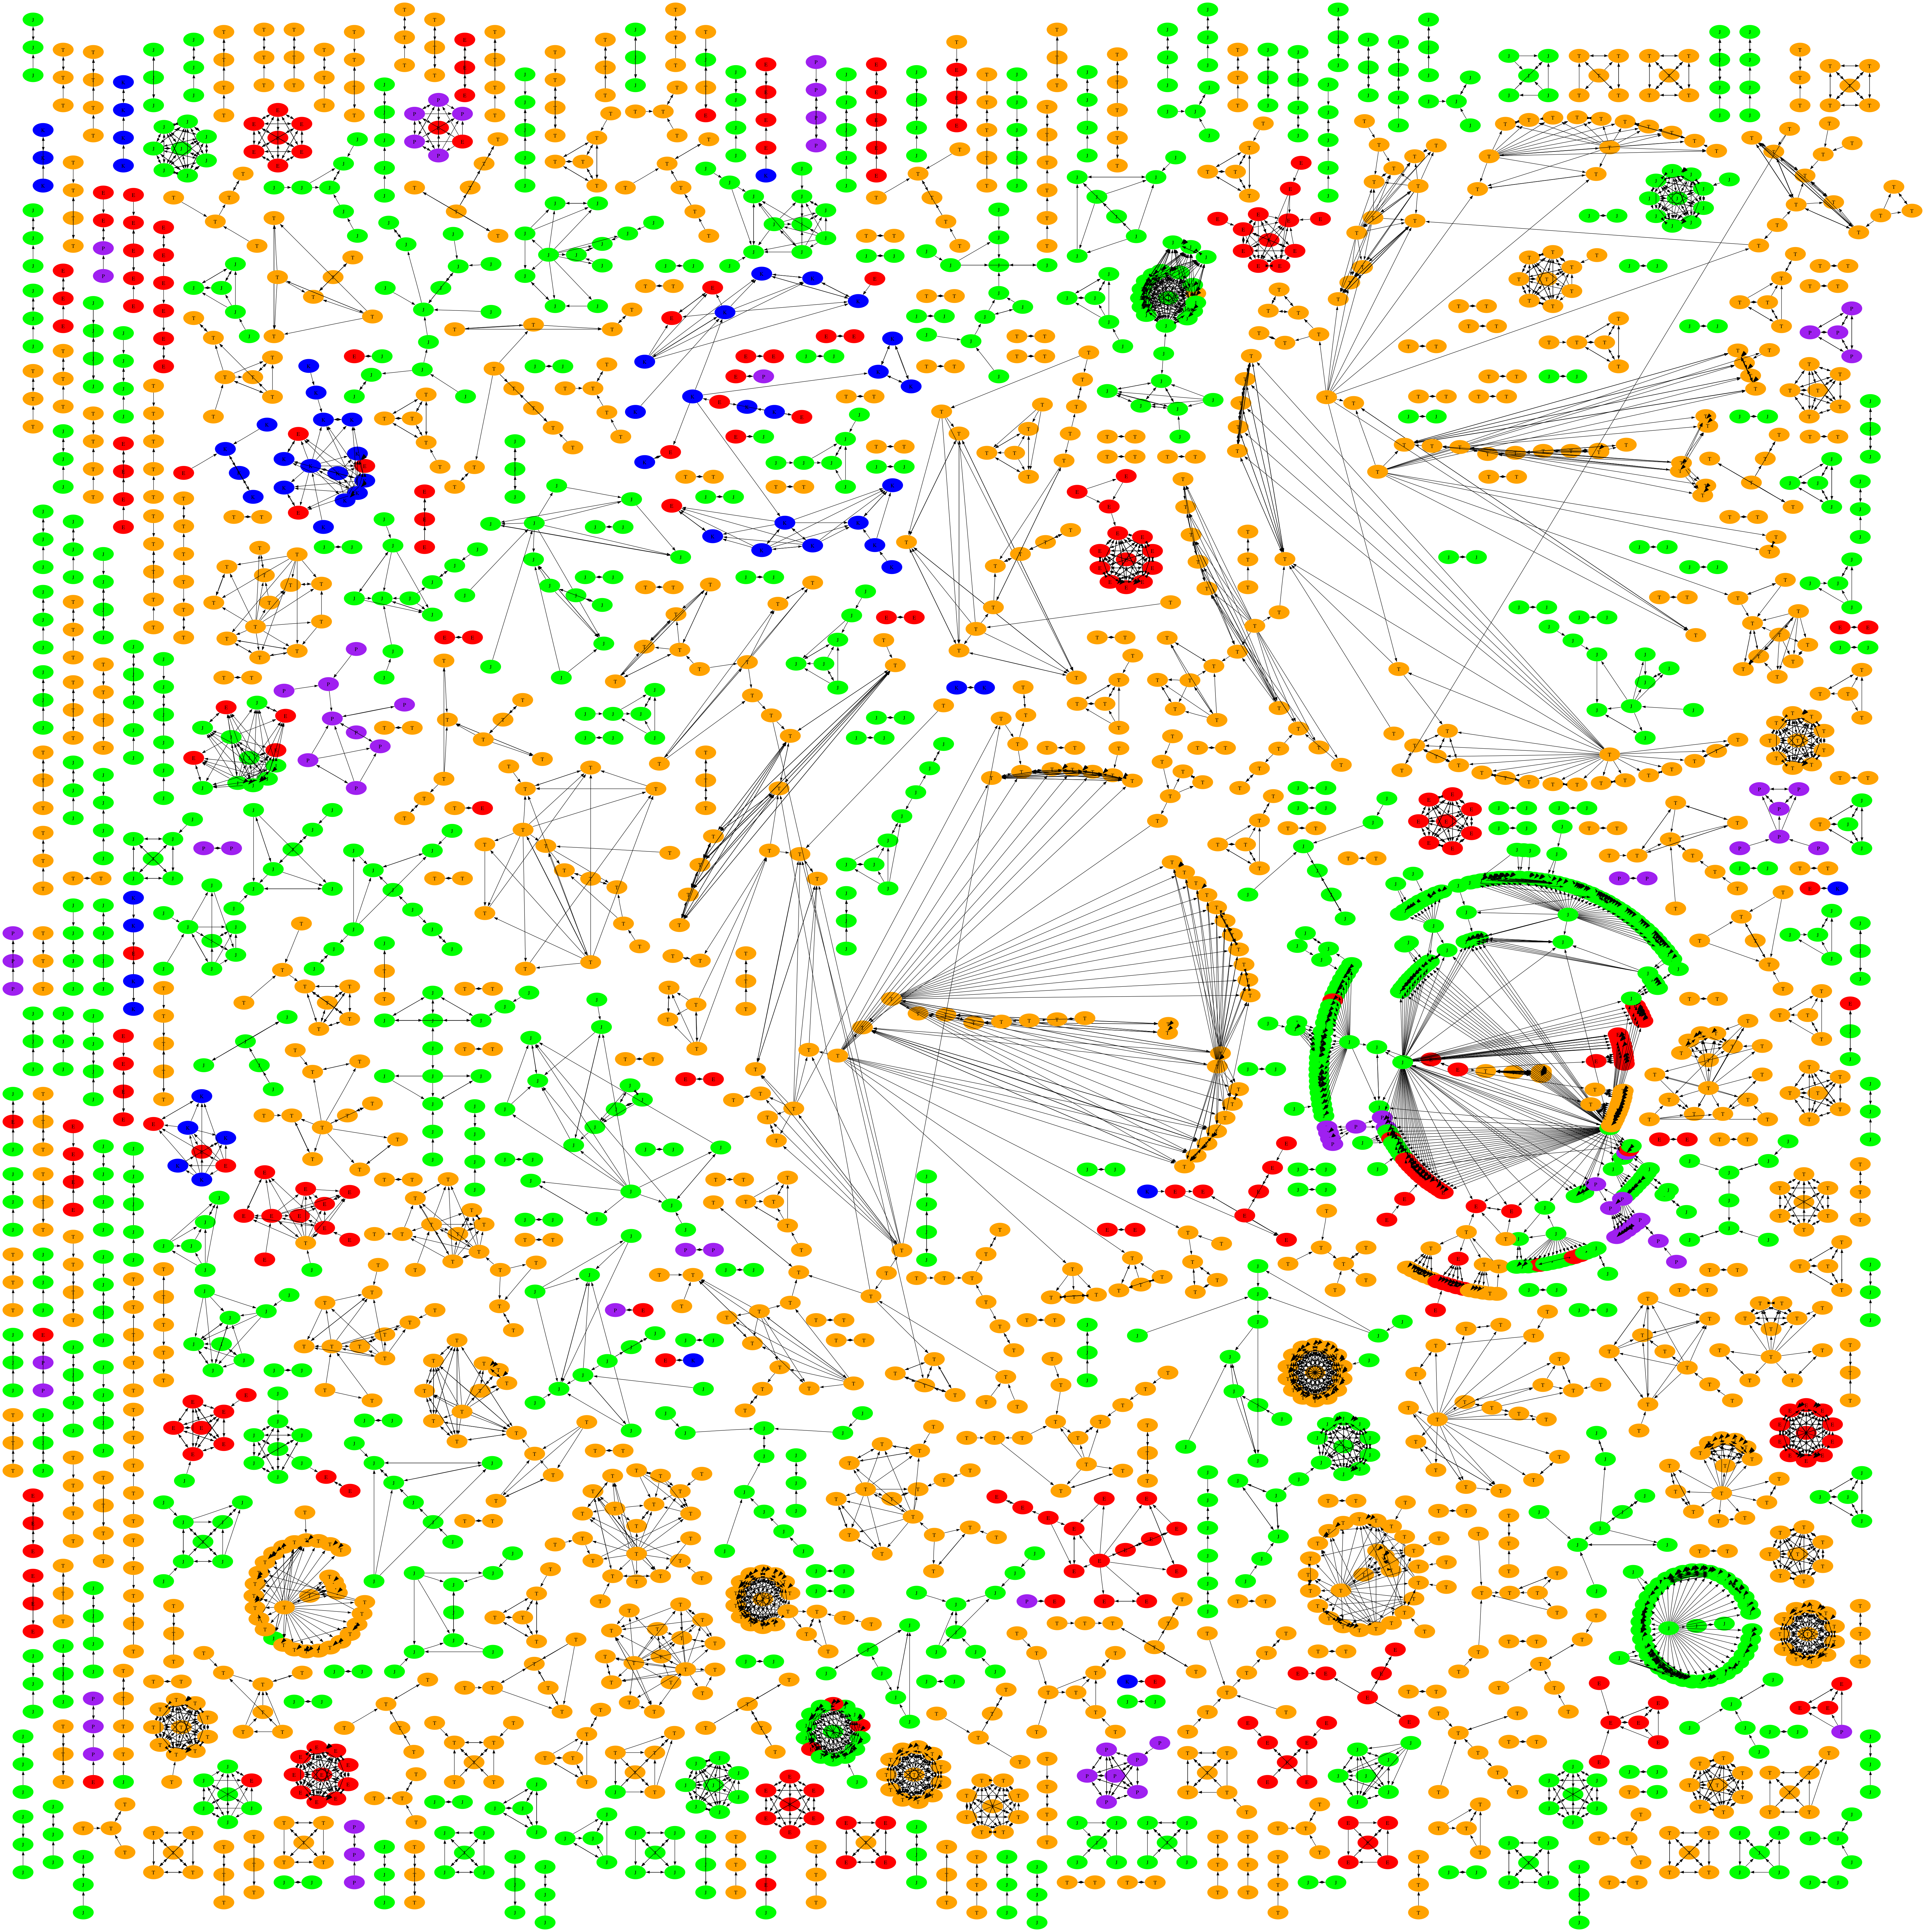
Timbl (Tilburg
Memory-based learner) is a machine learning program based on the
principle of k nearest neighbour (knn) classification. That is,
it can infer the class of new, unseen instances by looking for
similarity with instances seen earlier, its so called nearest
neigbours. I have played around for some time with ways to
visualize the nearest neigbour relations among a given set of
instances. Below is an example of the type of graphics that can be
generated with the knngraph tools (with some manual tweaking of the
colors though). This graph is produced on the basis of the training
instances of the diminutive example, which comes with the Timbl
distribution. The nodes represent the instances, labeled according the
five classes (E, J, K, P, T) which occur as diminutive suffices of
Dutch nouns. The arcs represent the nearest neigbour relations among
the instances. These were obtained by both training and testing Timbl
on the diminutive set (using default settings, except for k=2), and
extracting the nearest neigbours from the output file (using Timbl's
+vn option). The lay out and drawing of the graph was done by
dot, which is part of the graphviz
package.
WARNING: LARGE FILE! (7.8 MB) YOUR BROWSER MAY NOT BE ABLE TO
RENDER THIS.
Another nice idea I have is to make the graph
clickable. Graphviz can, in addition to images, also produce
image maps for use in html, allowing you to associate arbitrary
URL's with predefined regions of the image. This means that, in
principle, you set things up in such way that clicking on a node shows
the features of the corresponding instance in another frame, and
clicking on an arc shows the corresponding distance. This seems to be
a really nice way to explore an instance base. Unfortunately, the
browsers I've tried so far (Safari, Mozilla, IE) cannot handle images
and image maps this large. One alternative may be to chop up the graph
in smaller, unconnected subgraphs. If anyone is interested in writing
a special purpose tool for inspecting instance bases along these
lines, please contact me.
This is the README file for knngraph, version 1.0 beta.
--------------------------------------------------------------------------------
Description
--------------------------------------------------------------------------------
knngraph is a set of rather trivial command line tools, written in
Python, to visualize the nearest neighbours relations in a Timbl
instance base. It uses neato (part of the graphviz package for
automatic graph layout) to draw the instance base as a graph with the
instances as nodes and their nearest neighbour relations as arcs. It
consists of two files:
- indexcol: adds an index as the first column to an instances file
- timblout2graph: transforms Timbl output to a neato graph
--------------------------------------------------------------------------------
Platform
--------------------------------------------------------------------------------
Tested on Linux and OS X (10.3, Panther). Should work on any OS with a Python
interpreter and neato. (Will probably run on MS windows as well,
although I have not tested it.)
--------------------------------------------------------------------------------
Requirements
--------------------------------------------------------------------------------
- a recent version of Timbl (5.0 or later)
- neato, which is part of the grapviz package
- a recent version of Python (2.3 or later)
--------------------------------------------------------------------------------
License
--------------------------------------------------------------------------------
You are free to use, copy, distribute and modify this software.
--------------------------------------------------------------------------------
Author:
--------------------------------------------------------------------------------
Erwin Marsi (see the file CONTACT)
--------------------------------------------------------------------------------
Install
--------------------------------------------------------------------------------
Unzip the zip file anywhere you like
--------------------------------------------------------------------------------
Usage
--------------------------------------------------------------------------------
Generating a graph requires 4 steps.
1. Index your instance base
You have to add a unique number to each instance. This can be
accomplished by simply numbering the instances. For example,
indexcol -d, indexed.dimin.train
Will add a number as the first column to my_instance_base and write
the result numbered_instance_base. By default the column delimiter is
assumed to be a single space, hence the "-d," is used here to force a
comma as the delimiter.
2. Classification
Run Timbl, using the instance base both as training and test
material. Use the "+vn" trace option to dump the nearest neighours to
the output
Timbl -k2 -f indexed.dimin.train -t indexed.dimin.train -o indexed.dimin.train.out +vn
3. Generating a graph specification
Use timblout2graph to generate a graph specification for neato.
./timblout2graph graph.spec
Optionally, you can edit this file to modify the format of the nodes
and arcs. For instance, to give all nodes for class "T" the colour red, replace
[label=T];
with
[label=T,style=filled,color=red];
See the neato (or dot) manual for all formatting options.
4. Generating a graph
Finally, use neato to produce a drawing. To write a postscript file:
neato -Tps -o graph.ps
|